Splunk observability probe
The Splunk Observability probe allows you to query Splunk Observability(Signalfx) metrics and compare the results against specified criteria.
Prerequisites
To use the Splunk Observability probe, you need:
- An active Splunk Observability(signalfx) account
- Access to the Splunk Observability API from the kubernetes execution plane
- An API token for authentication
Interactive Setup Guide
Follow along with this interactive guide to learn how to configure Splunk Observability probe:
Steps to configure
-
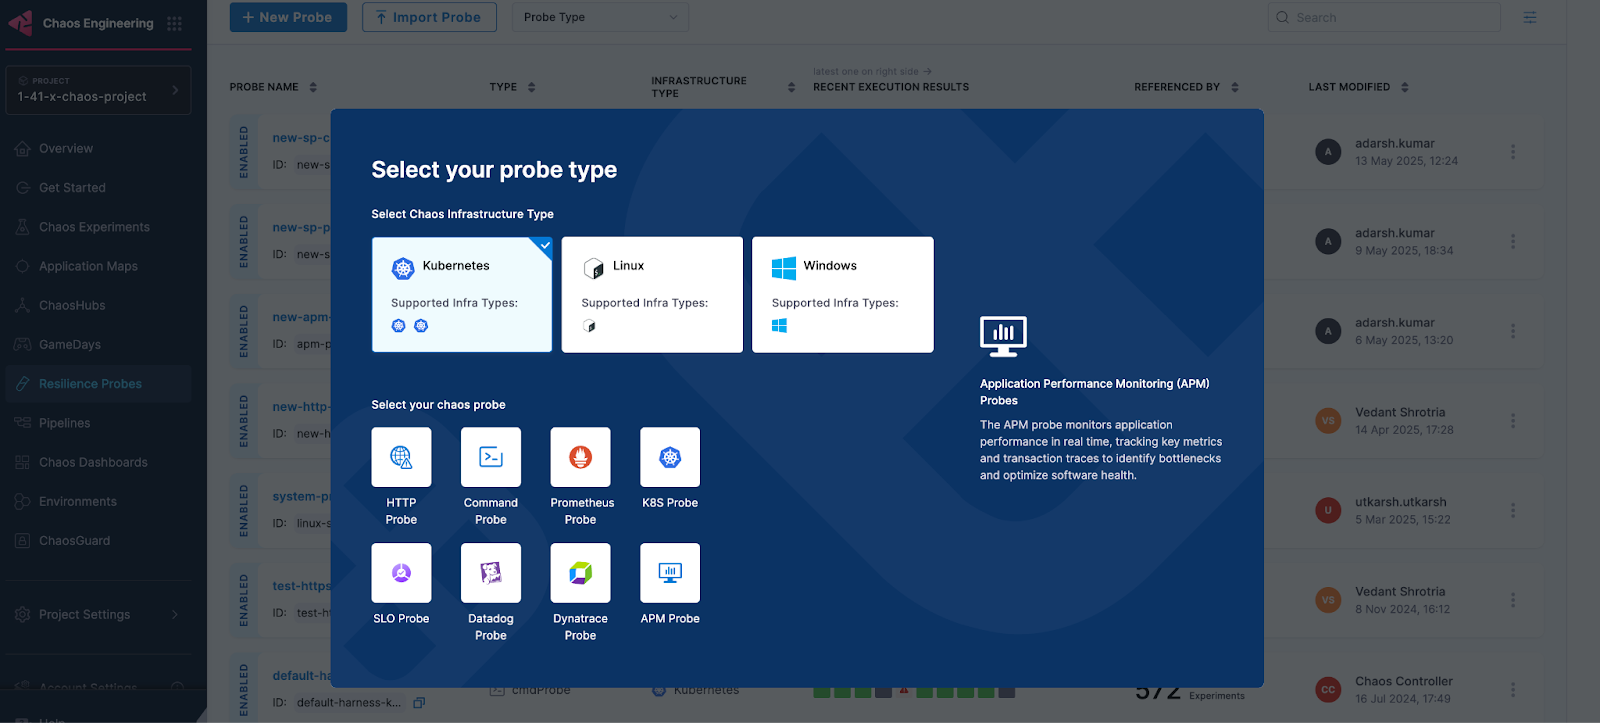
In Resilience probe section under chaos module, click on New Probe button
-
Select the APM Probe
-
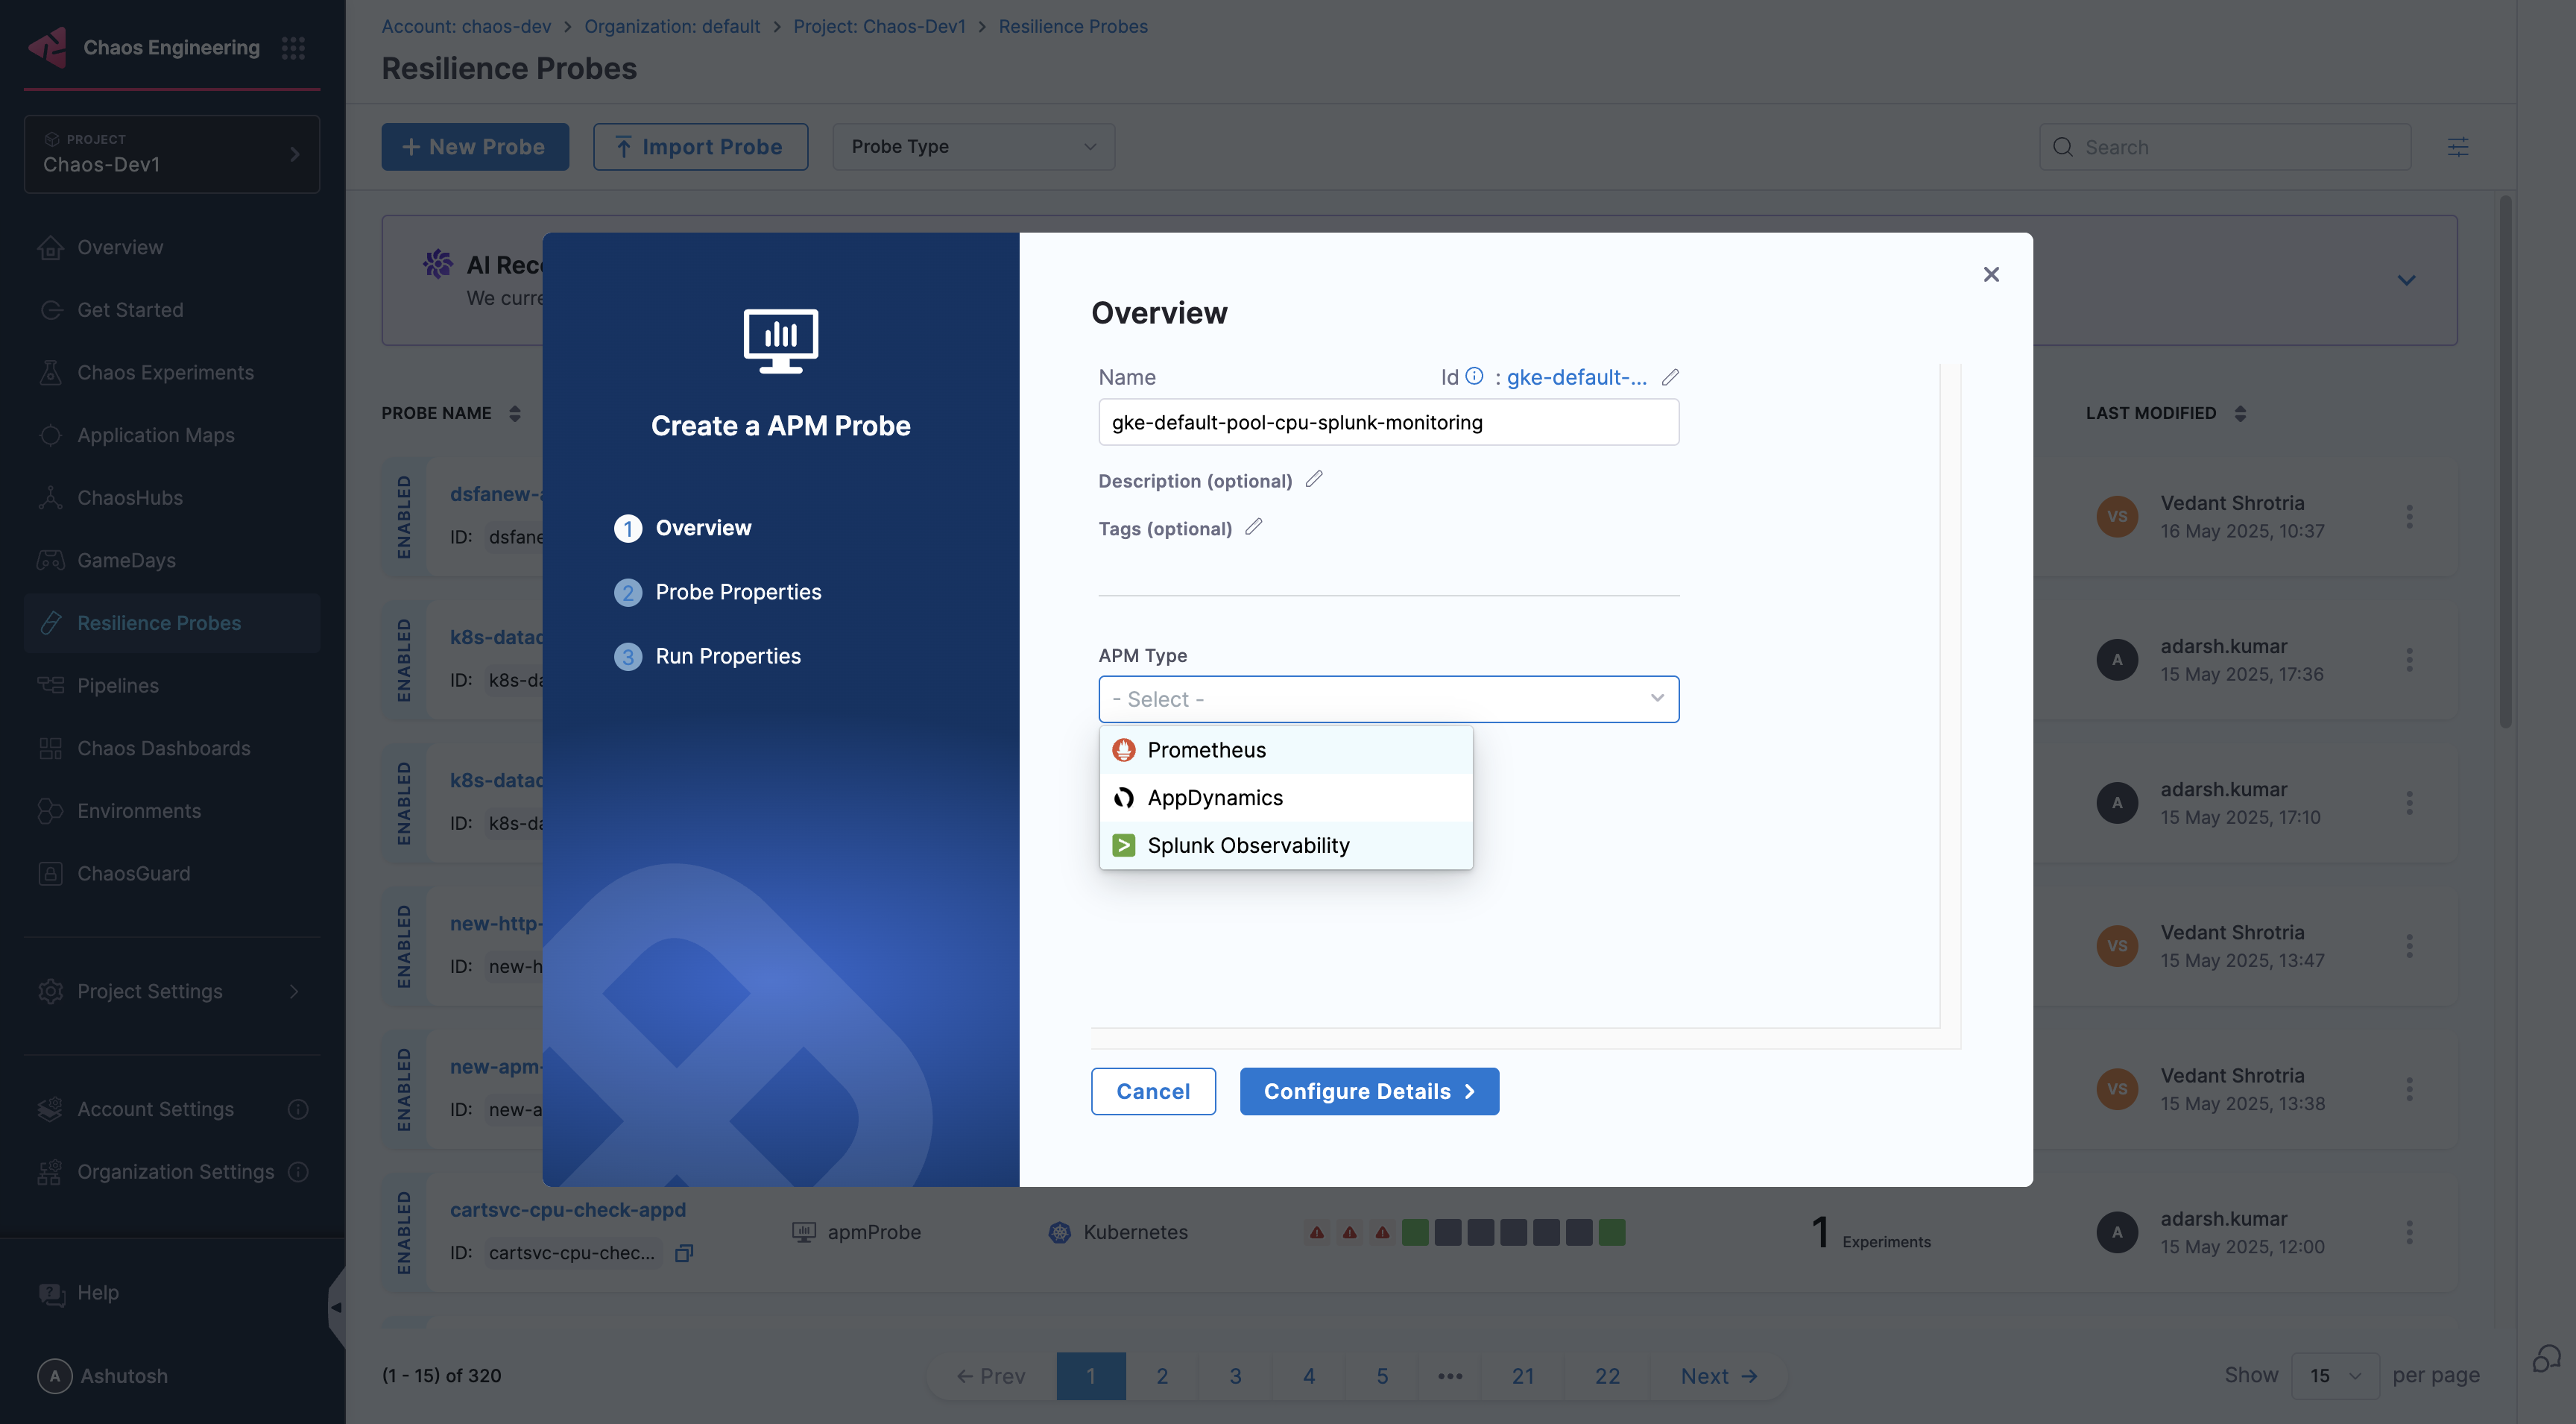
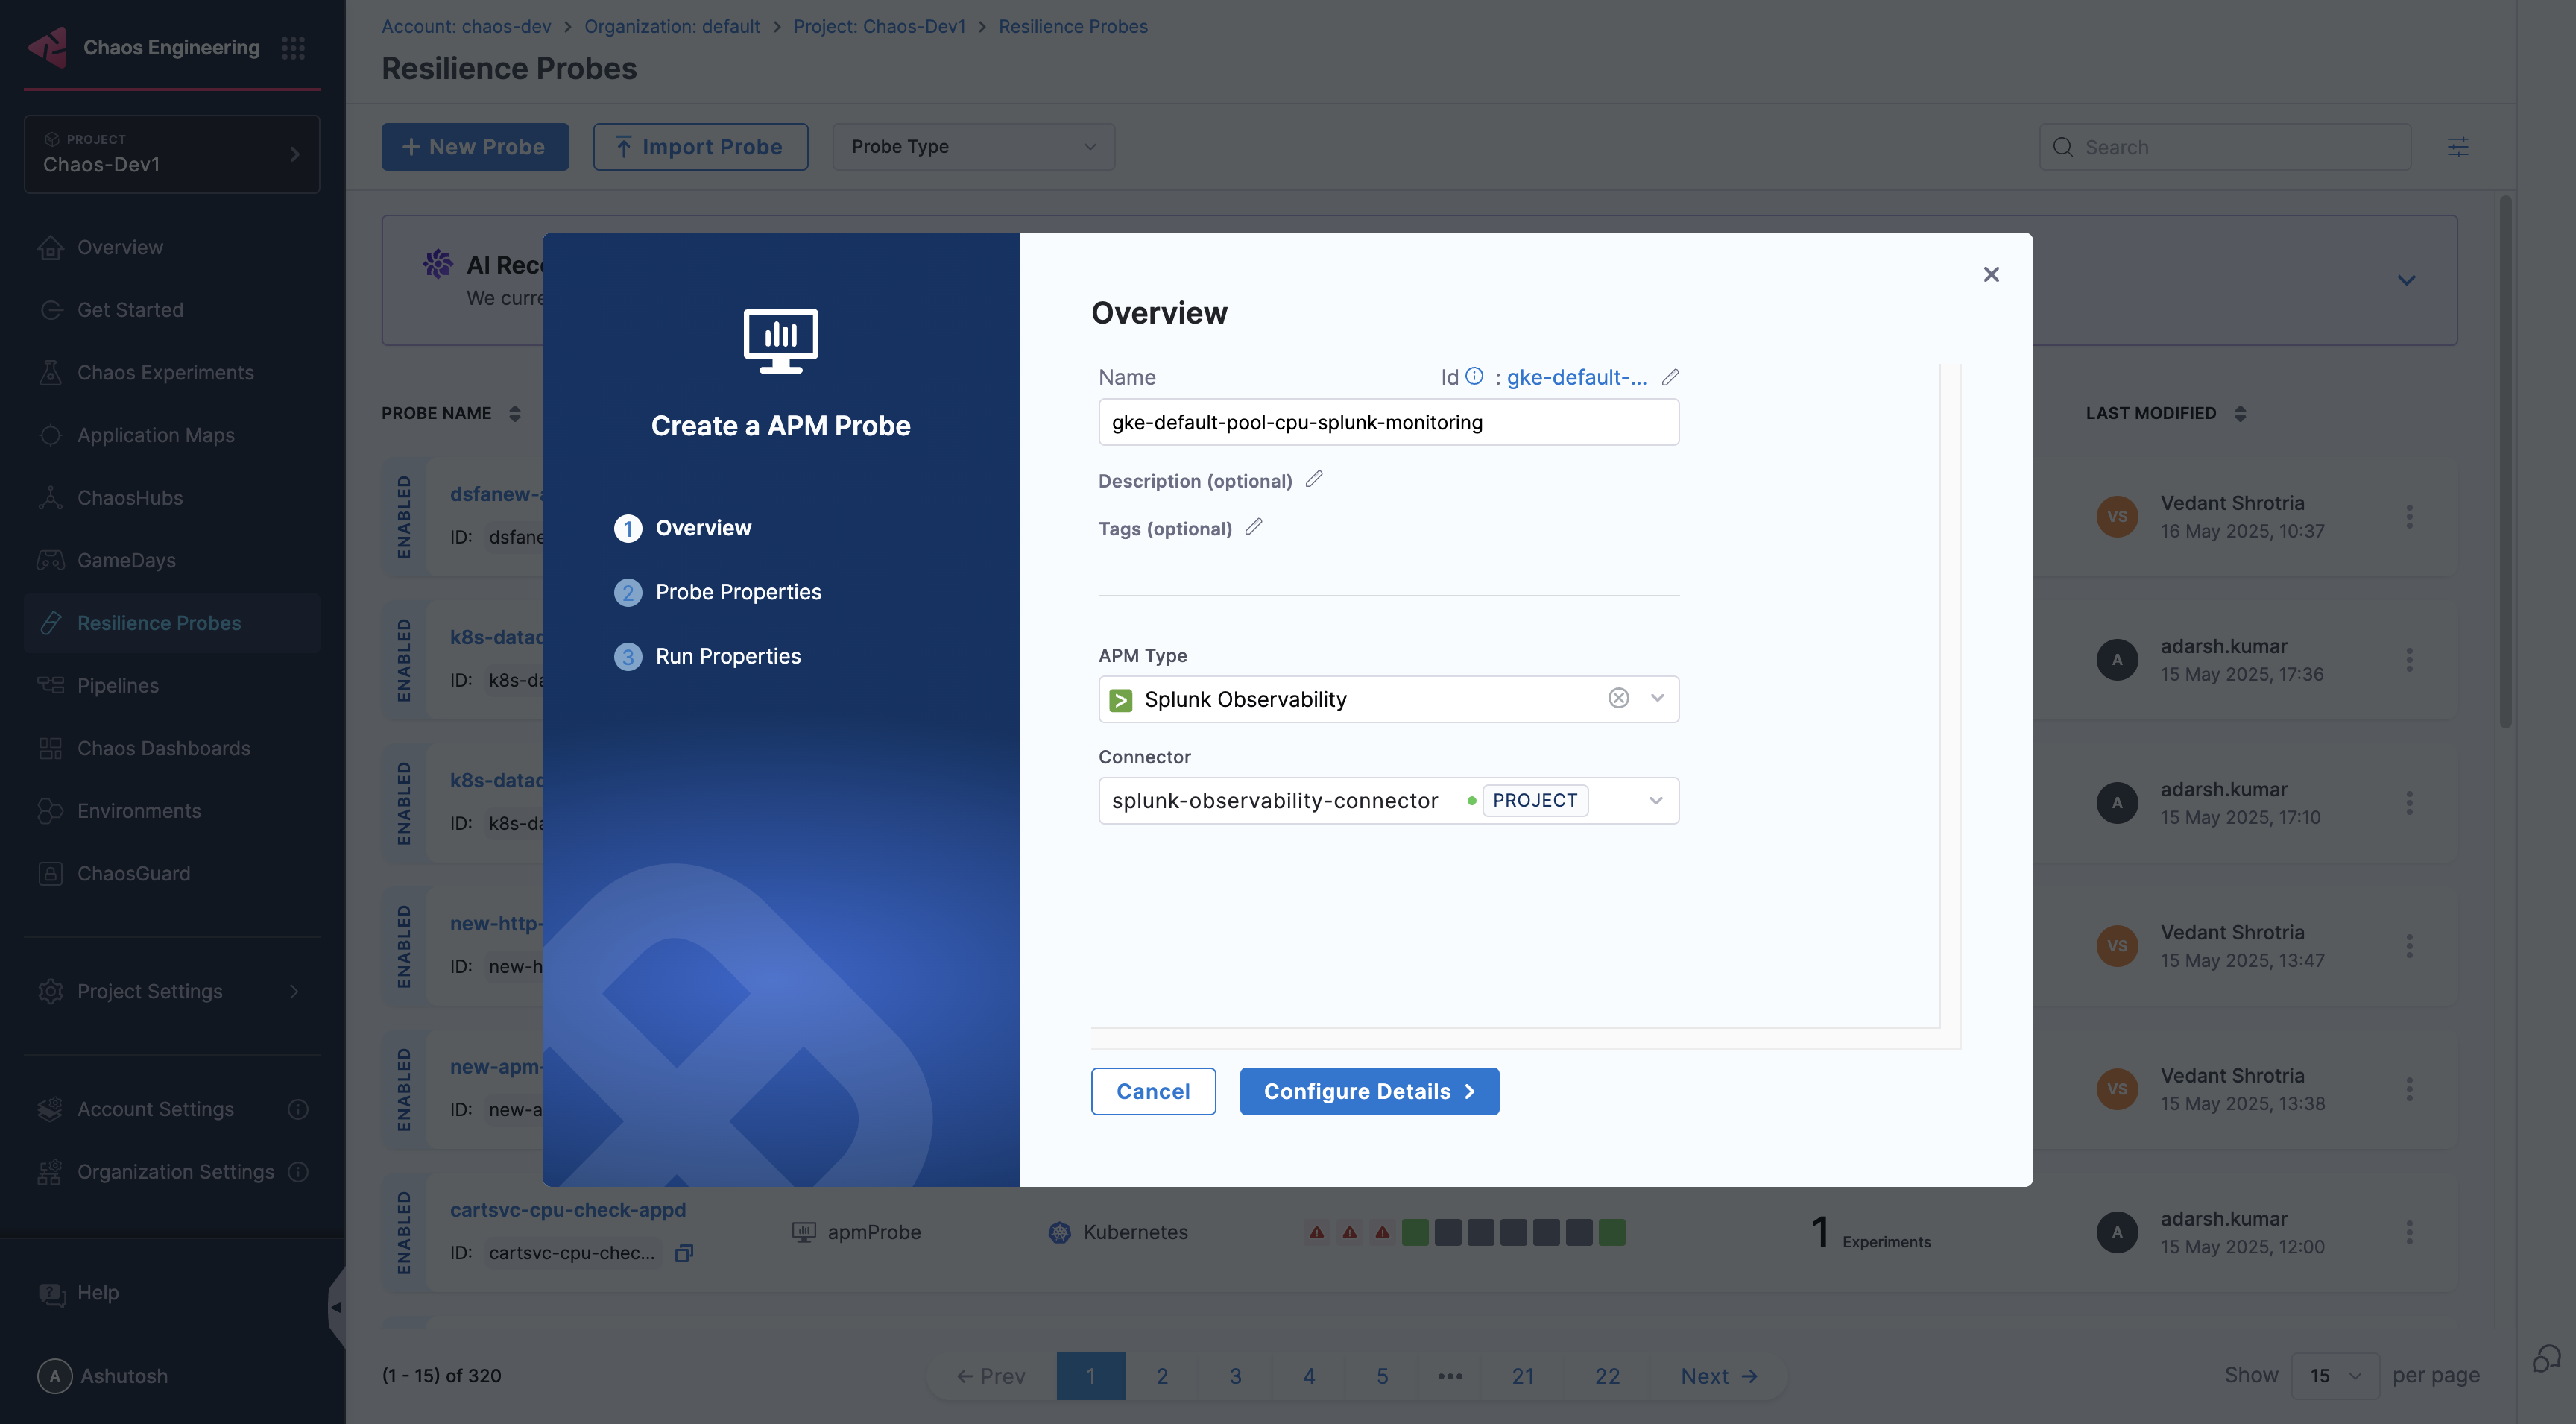
Provide the name of the probe and select Splunk Observability under APM Type
-
Under Splunk Observability connector select connector
-
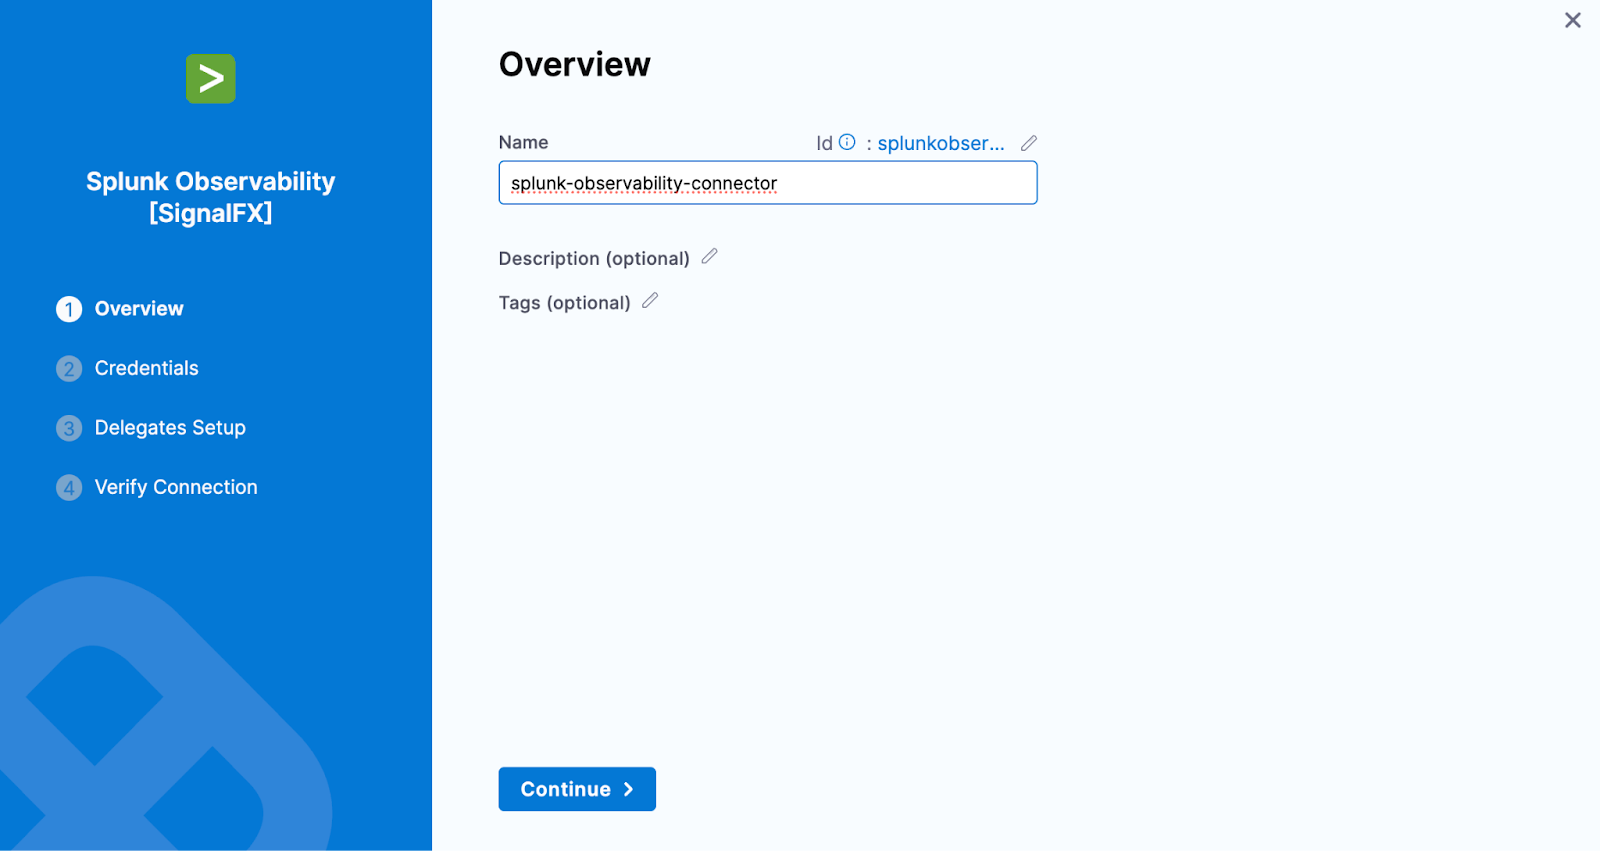
In Connector settings, you can either choose an existing connector or click New Connector
-
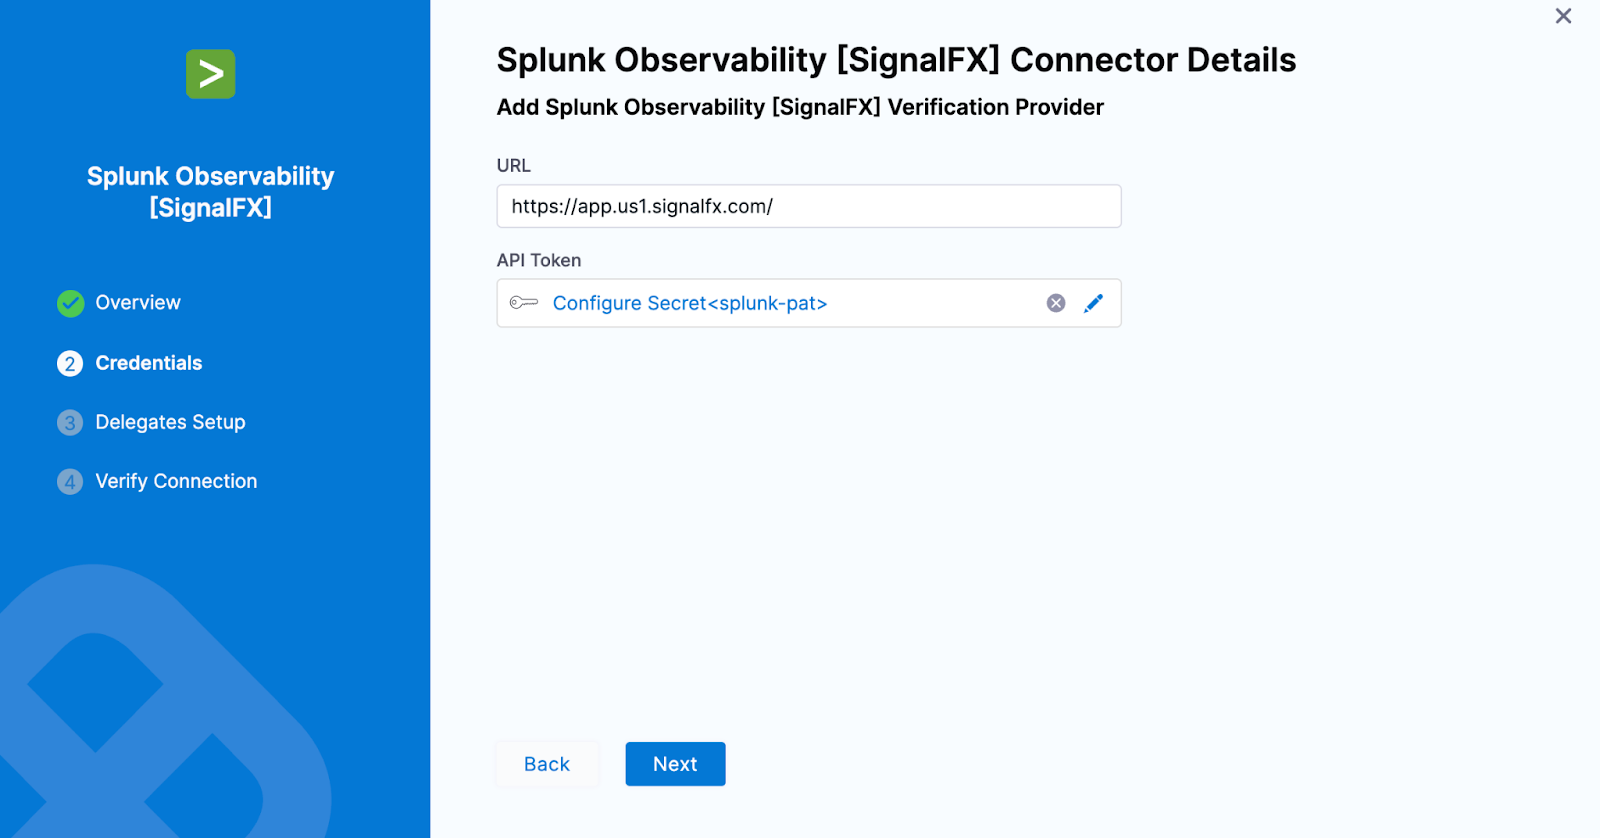
Provide the credentials of the Splunk Observability
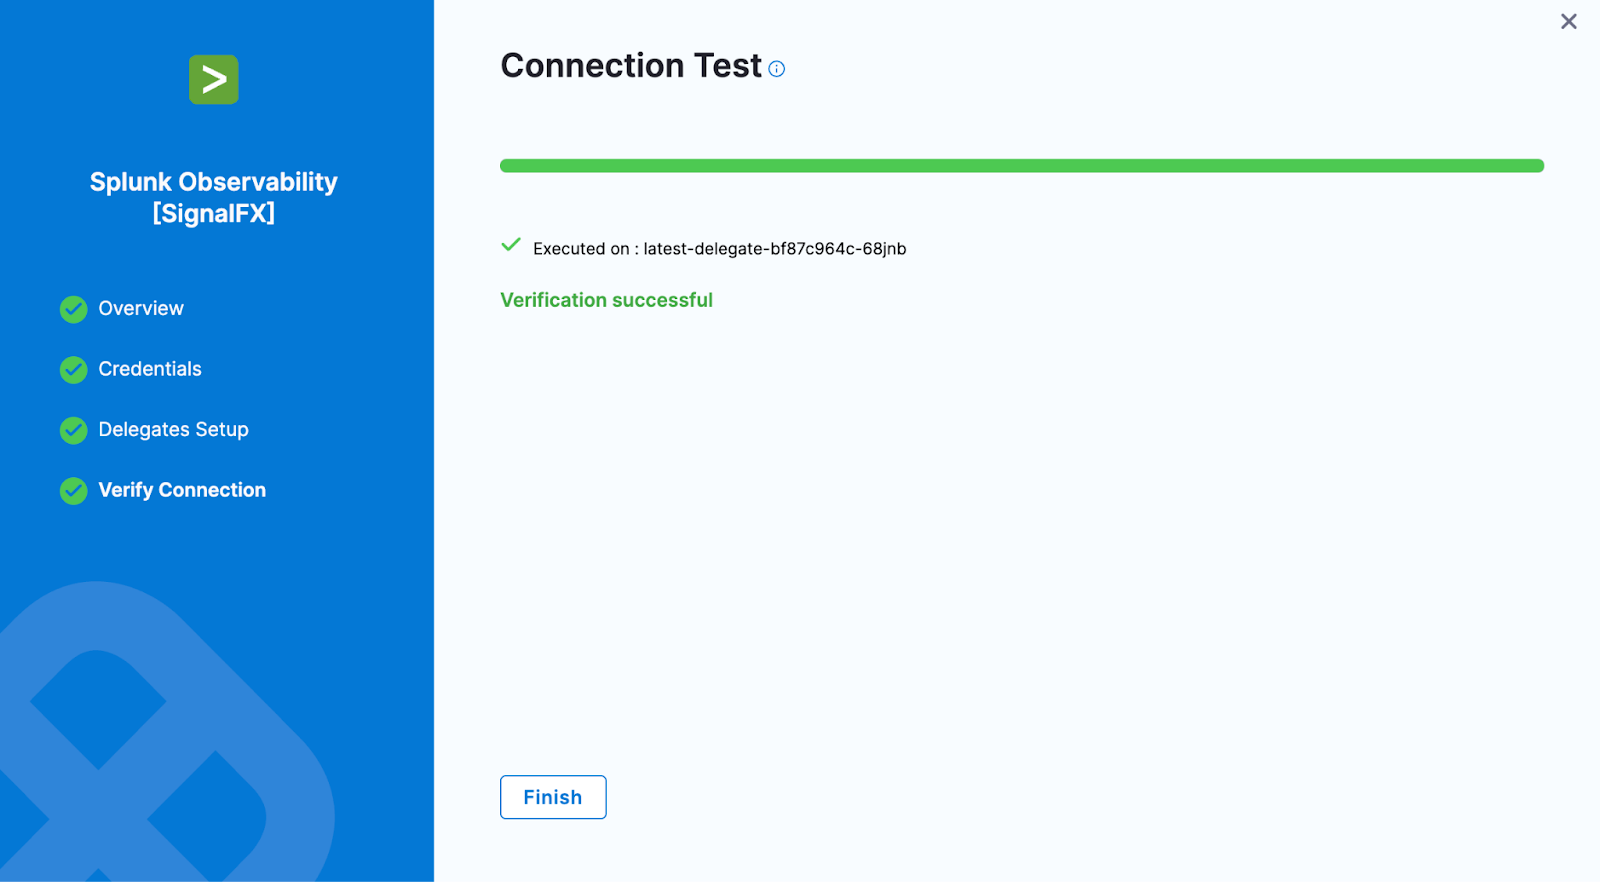
-
Select the delegate and verify the connection and click on Finish
-
Now connector is created and selected, click on Configure Details
-
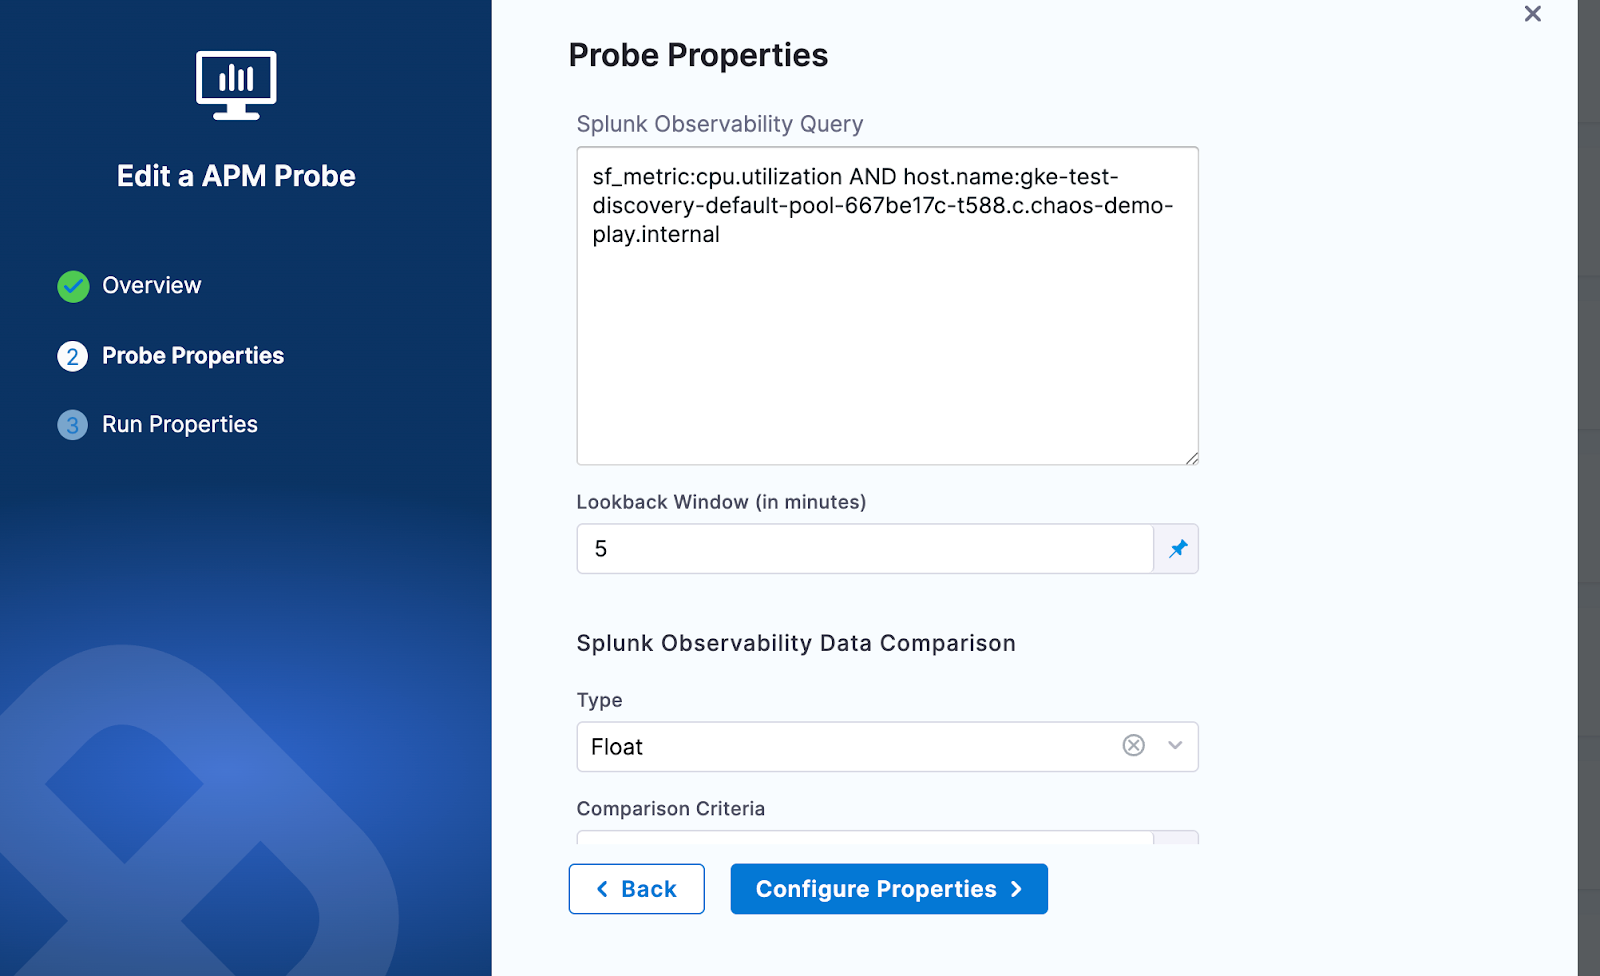
Under Probe Properties, Pass the value of Splunk Observability Query and Lookback Window
- Splunk Observability Query:
- The Splunk Observability Query input is a string that specifies the search criteria for the metric time series (MTS) you want to retrieve. It follows a specific syntax that allows you to search for metrics, dimensions, properties, and tags
- Example query:
sf_metric:cpu.utilization AND host.name:gke-default-pool-667be17c-t588.c.test.internal - For more details refer to query section in Splunk Observability doc
- LookBack Window (In Minutes):
- The lookback window refers to the time range from a specified number of minutes ago up to the current moment, over which data is aggregated
- Splunk Observability Query:
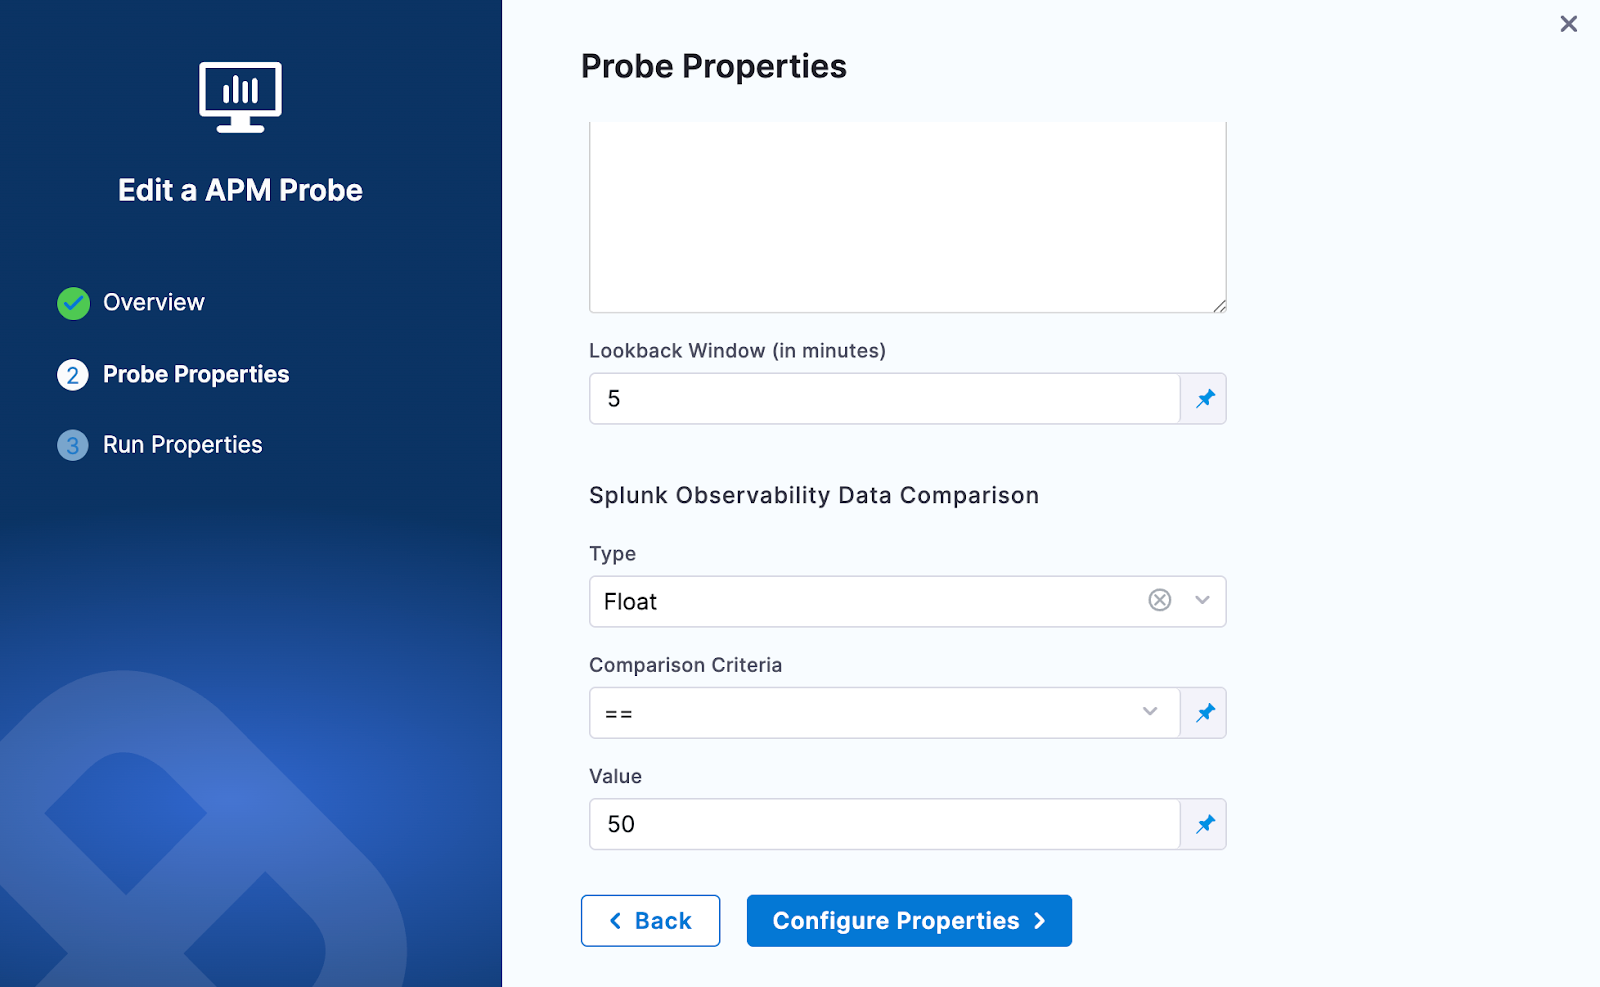
-
Provide the comparison criteria under Splunk Observability Data Comparison
-
Provide the Run Properties
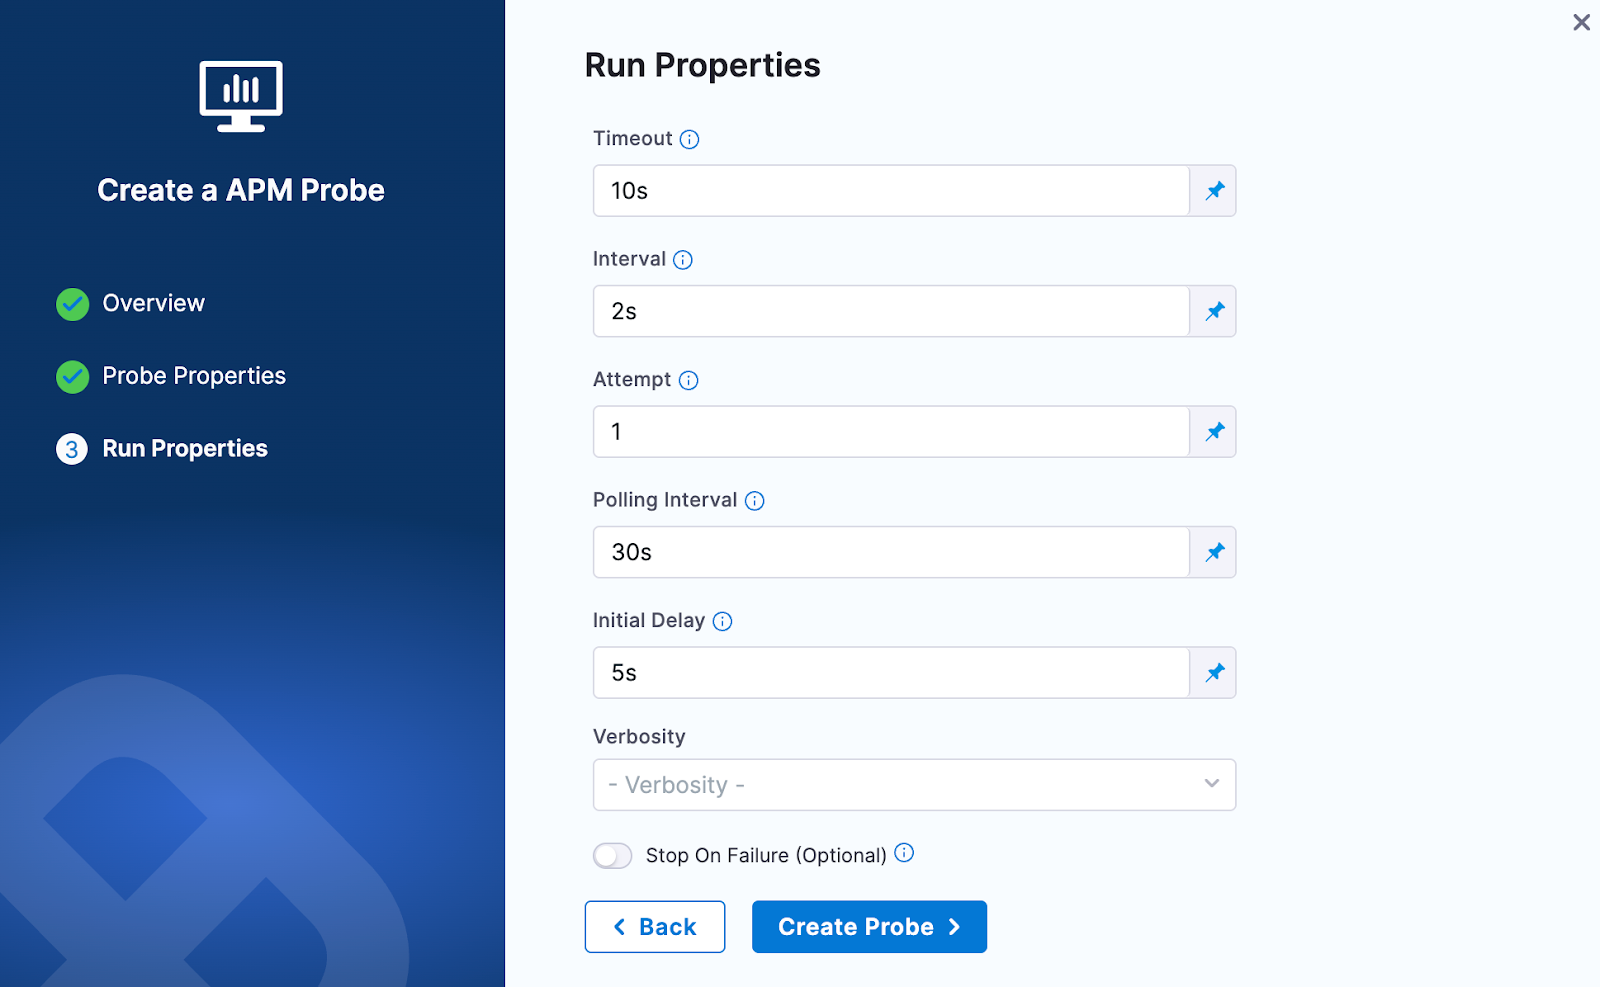
-
Then click on Create Probe